


The latest bitcoin price rally has pushed the asset into an extremely overbought region which could likely result in an interim crash.
The Relative Strength Indicator (RSI), an oscillator which studies the speed and change of price movements, measures a market’s sentiment on a scale of 0 to 100. When RSI is above 70, it defines the market as overbought. And when it is below 30, the same indicator defines the market as oversold. The current bitcoin price action shows that the daily RSI has established 2019’s top towards 87, which means bitcoin is extremely overbought.

Bitcoin confirms 2019 RSI peak | SOURCE: YAHOO FINANCE
The last time bitcoin’s daily RSI had entered its overbought zone – in a no-fakeout action – was in December 2017. On the 7th of the month, when bitcoin closed the market at $16,880 in a then-ongoing upside momentum, the RSI had touched 95. What followed later was a correction towards $13,214 – a 23-percent price drop, which alongside brought the RSI down to 72. Later, bitcoin established its all-time high towards $20,000 only to enter its most extended bearish phase in 2018.
AN INTERIM BITCOIN CRASH LIKELY
The bitcoin’s daily RSI momentum is close to exhaustion for now. It is likely that the asset price drops by huge margins, initially towards its 200-daily moving average (the red curve) while maintaining a downside target towards the 50-period EMA (the blue curve). Such a price move would bring the RSI back below 70, with a probability to retesting 50 as a proven accumulation area.

If you’re looking for a bear case, this is the most overbought $BTC has been on the Daily since $20k...
Moon or rekt?


68 people are talking about this
From a weekly perspective, the bitcoin RSI is on the crossroads between bulls and bears. The historical price action suggests that bitcoin never initiated a strong upside action as long as the weekly RSI remained below 56. The November-December 2017 surge saw the RSI briefly breaking above 56. Similarly, ahead of the November 2013 jump, the RSI had sustained itself 56. The same pattern could be noted during the April 2013 and January 2012 rallies. Those point of contacts ahead of every surge are hard to miss.
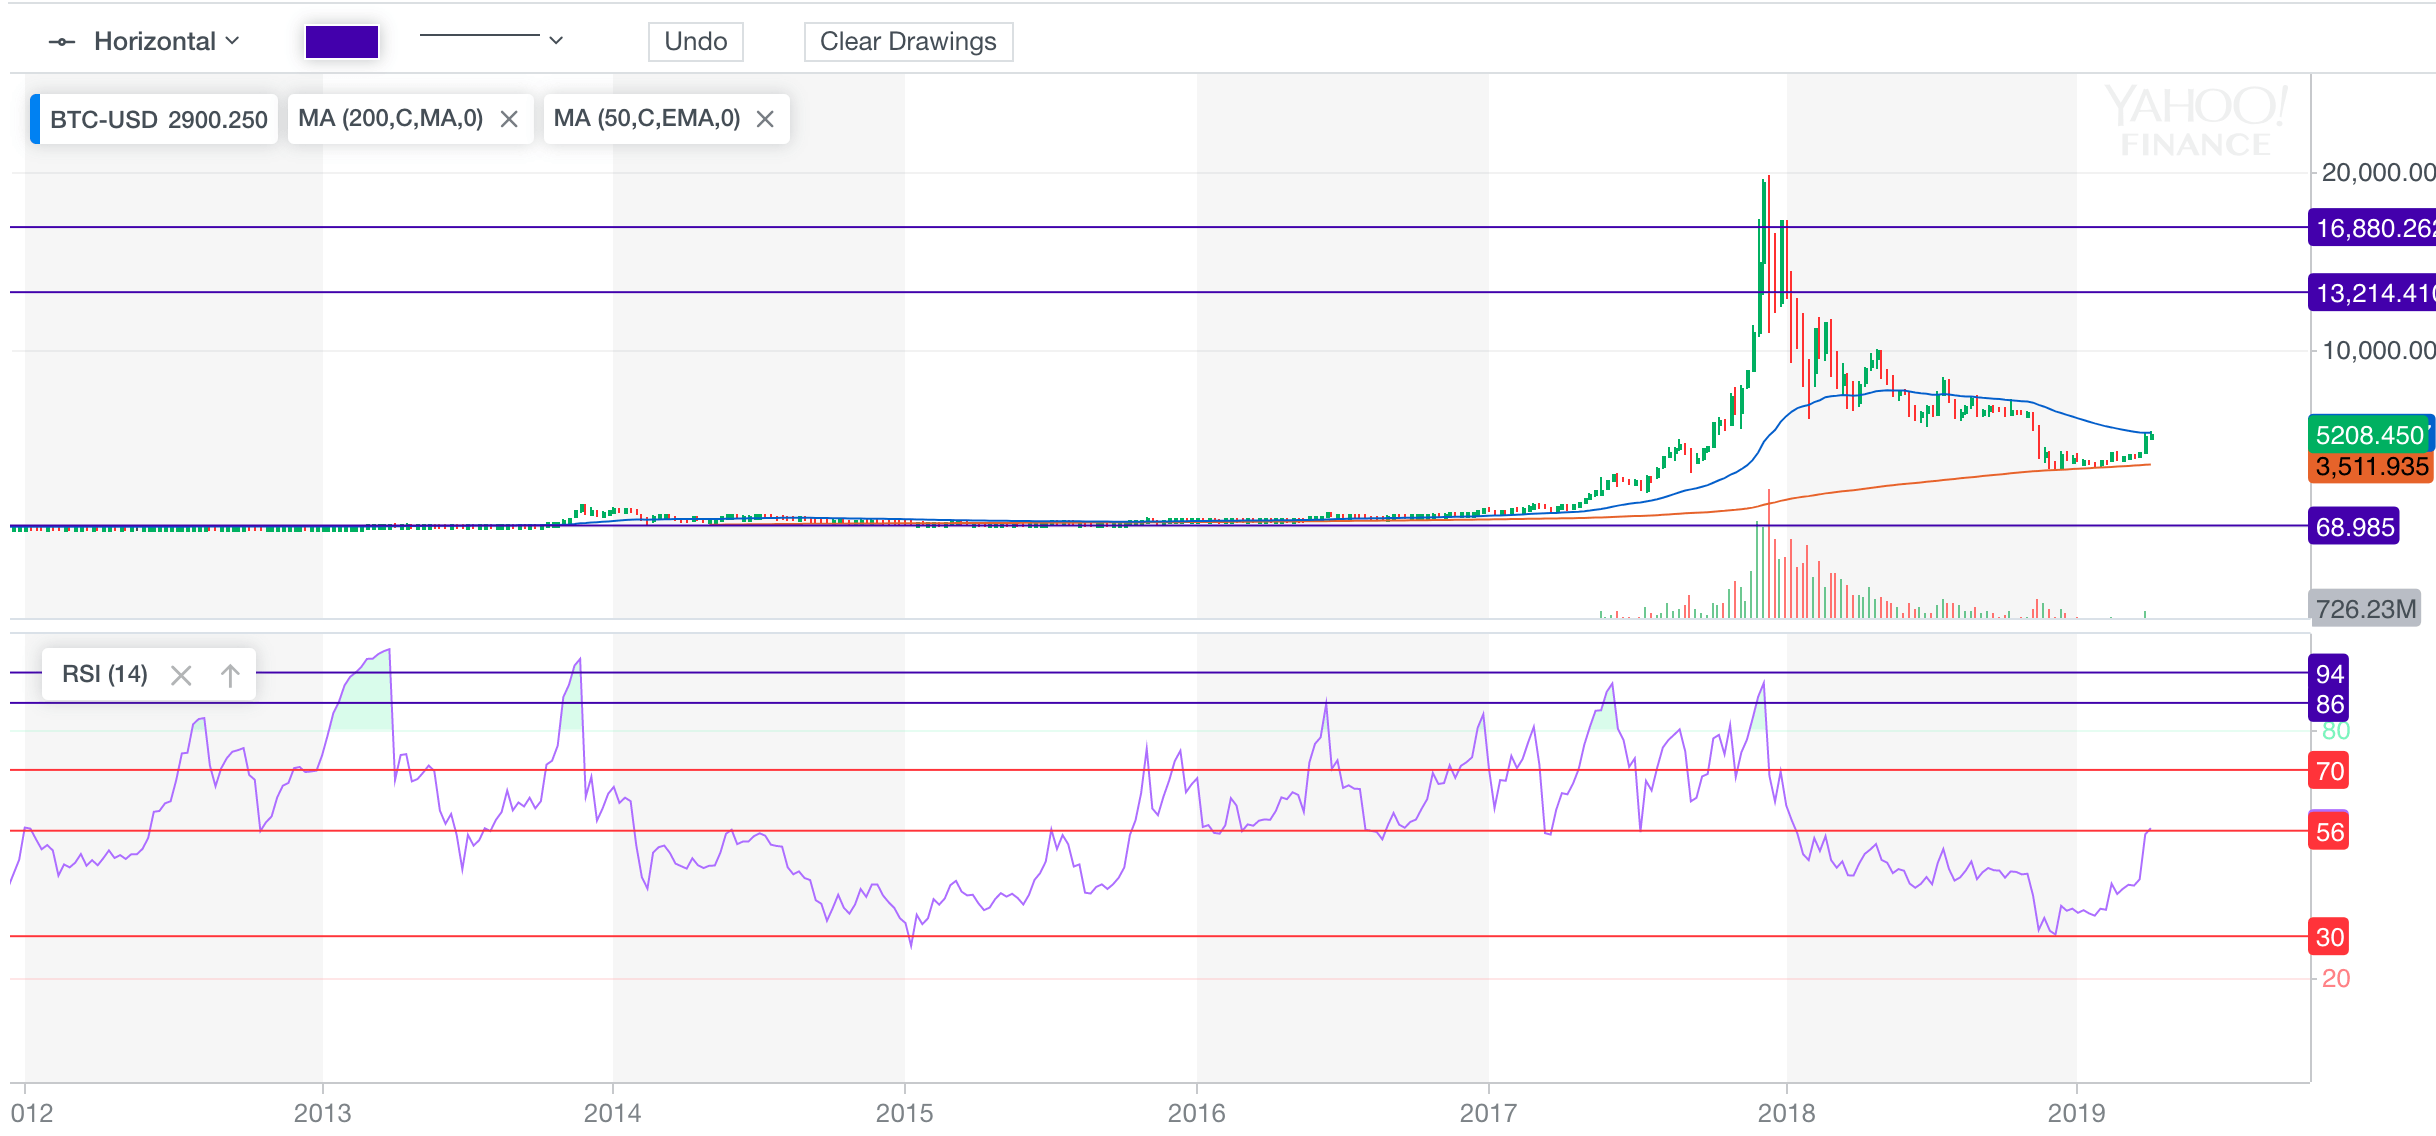
56-RSI is a key upside barrier | SOURCE: YAHOO FINANCE
The interim overbought signals point that bitcoin’s weekly RSI would fail to go beyond 56 for now. But as soon as it breaks above the said level, bulls can expect a strong upside momentum with a higher probability to go beyond $6,000.

